Tunnex separates the management plane from the traffic path. Monitor both: a healthy web/API process does not prove a WireGuard handshake, and a temporarily unavailable control plane does not necessarily interrupt an established tunnel.
There is no separate Operations route in the current console. Use Overview, gateway/device detail, Access Events, Audit Log, and Settings → Features together; backup/restore remains a host-terminal procedure.
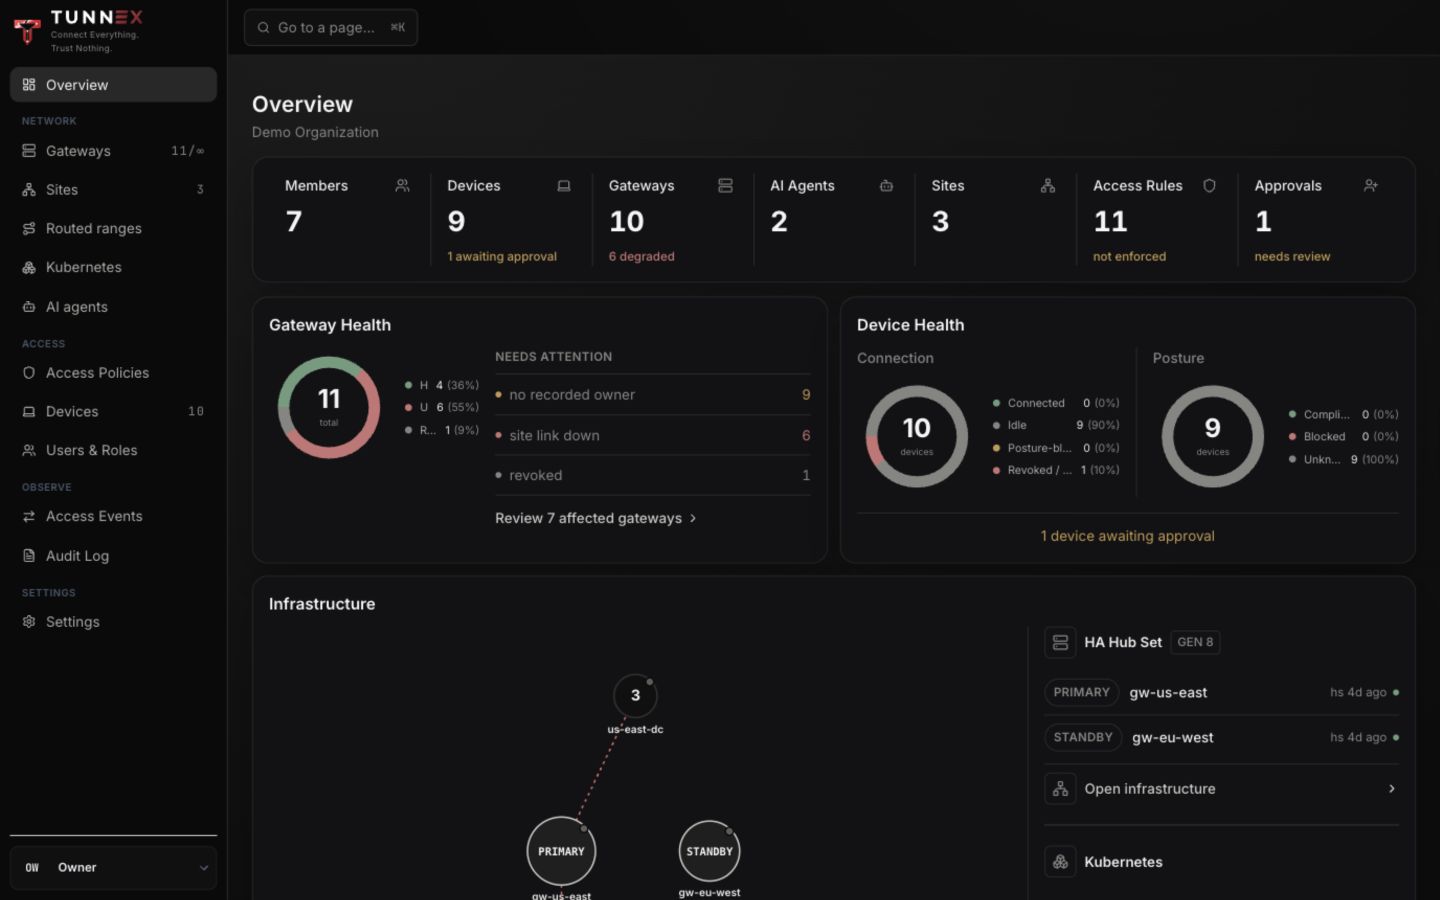
Synthetic dev data captured through an SSH-forwarded control plane. Its stale gateway reports deliberately demonstrate degraded states; they are not production availability evidence.
Daily checks
Section titled “Daily checks”In the console, start at Overview and check fleet summary, gateway health, device health, infrastructure, site HA, and Kubernetes. Open each degraded card; do not treat the summary count as the diagnosis.
From a public-installer deployment directory:
cd tunnexsudo docker compose -f tunnex.yml pssudo docker compose -f tunnex.yml exec -T api \ wget -qO- http://127.0.0.1:8080/healthzsudo docker compose -f tunnex.yml exec -T api \ wget -qO- http://127.0.0.1:9090/readyzsudo docker compose -f tunnex.yml exec -T node-agent wg showInterpret those signals separately:
| Signal | Healthy result | What it proves |
|---|---|---|
/healthz | HTTP 200 | The API process is alive |
/readyz | ok leader or ok follower | PostgreSQL ping succeeded; the response also reports scheduler role |
docker compose ps | Required services running/healthy | The local deployment is up |
wg show | Recent handshake and increasing counters | The gateway data plane has exchanged traffic |
| Console health | Current gateway reports and applied revision | Control-to-gateway reconciliation is current |
A follower is intentionally ready and does not run periodic schedulers. Readiness
does not check Redis, so browser sessions can still fail while /readyz is 200.
sudo docker compose -f tunnex.yml logs --since=30m apisudo docker compose -f tunnex.yml logs --since=30m node-agentsudo docker compose -f tunnex.yml logs --since=30m postgres redis caddyPrefer a bounded time window. Before sharing output, remove join tokens, bearer credentials, certificates, complete WireGuard configurations, email links, and user-identifying data.
Useful gateway evidence includes:
- the most recent control-channel connection or certificate renewal;
- desired and applied policy revision identifiers;
- the reported health kind and its first occurrence; and
wg showhandshake time and byte counters, without private keys.
Prometheus metrics
Section titled “Prometheus metrics”The API exposes /metrics and /readyz on a separate listener. Its default is
127.0.0.1:9090 inside the API container, it is not published by the public
Compose file, and it has no application authentication.
Inspect it locally:
sudo docker compose -f tunnex.yml exec -T api \ wget -qO- http://127.0.0.1:9090/metricsFor remote scraping, add TUNNEX_METRICS_ADDR through a controlled Compose
override or deployment manifest, bind it only to a private interface, and place
network controls or an authenticated proxy in front of it. The public
tunnex.yml does not forward that variable from .env and does not publish port
9090; editing .env alone does not expose metrics. Never put an unauthenticated
wildcard listener on the internet.
The principal product metrics are:
| Metric | Meaning | Suggested alert |
|---|---|---|
tunnex_scheduler_leader | 1 on the replica holding scheduler leadership | Sum across replicas is zero |
tunnex_gateway_policy_health{kind="..."} | Fleet-wide count for each gateway health kind | Nonzero failure/degraded kinds sustained beyond convergence |
The gateway metric deliberately answers how many, not which. Use the console to identify the affected gateways.
Prioritize cert_expired_cannot_reconnect, unsupported_policy_version,
apply_failing, silent_desync, and persistent desync_unknown. Brief
converging is expected while a new revision settles.
Dependency failures
Section titled “Dependency failures”| Failure | Management-plane effect | Existing tunnels |
|---|---|---|
| PostgreSQL unavailable | Readiness returns 503; leadership is released; most API work fails | Gateways keep their last applied state |
| Redis unavailable | Browser/API sessions fail | Gateway mTLS and established tunnels do not depend on Redis |
| API unavailable | No sign-in, enrollment, approval, revocation, or policy updates | Last-applied gateway state continues |
| Gateway agent unavailable | No reconciliation or new revocations on that gateway | Already programmed forwarding can persist |
Last-known forwarding is an availability property, not proof of fresh policy. An offline gateway cannot receive a newly issued revocation until it reconnects.
Leader behavior
Section titled “Leader behavior”Request serving runs on every healthy replica; only periodic work is leader-gated. When a leader exits and its PostgreSQL connection closes, another replica normally acquires the advisory lock within about ten seconds. A leader that remains alive but is network-partitioned can retain a server-side session until TCP keepalive expires, so takeover can take minutes.
During leaderlessness, scheduled failover promotion, CRL rebuilds, retention sweeps, and re-key challenge pruning pause. Existing WireGuard traffic does not traverse the leader.
Maintenance checklist
Section titled “Maintenance checklist”Before planned work:
- Confirm a recent PostgreSQL dump, matching manifest, and separately stored master key.
- Run
preflightand resolve every refusal. - Record current gateway health and actual handshake evidence.
- Use a change window for database restore, routing, or gateway work.
- Afterward, verify readiness, gateway reconciliation, and real traffic—not just the dashboard shell.
See Backup and restore and Upgrades for the complete procedures.
Also configure Alerts and review Access events and audit evidence as separate operational signals.